Expand description
§Demo: 500_nodes
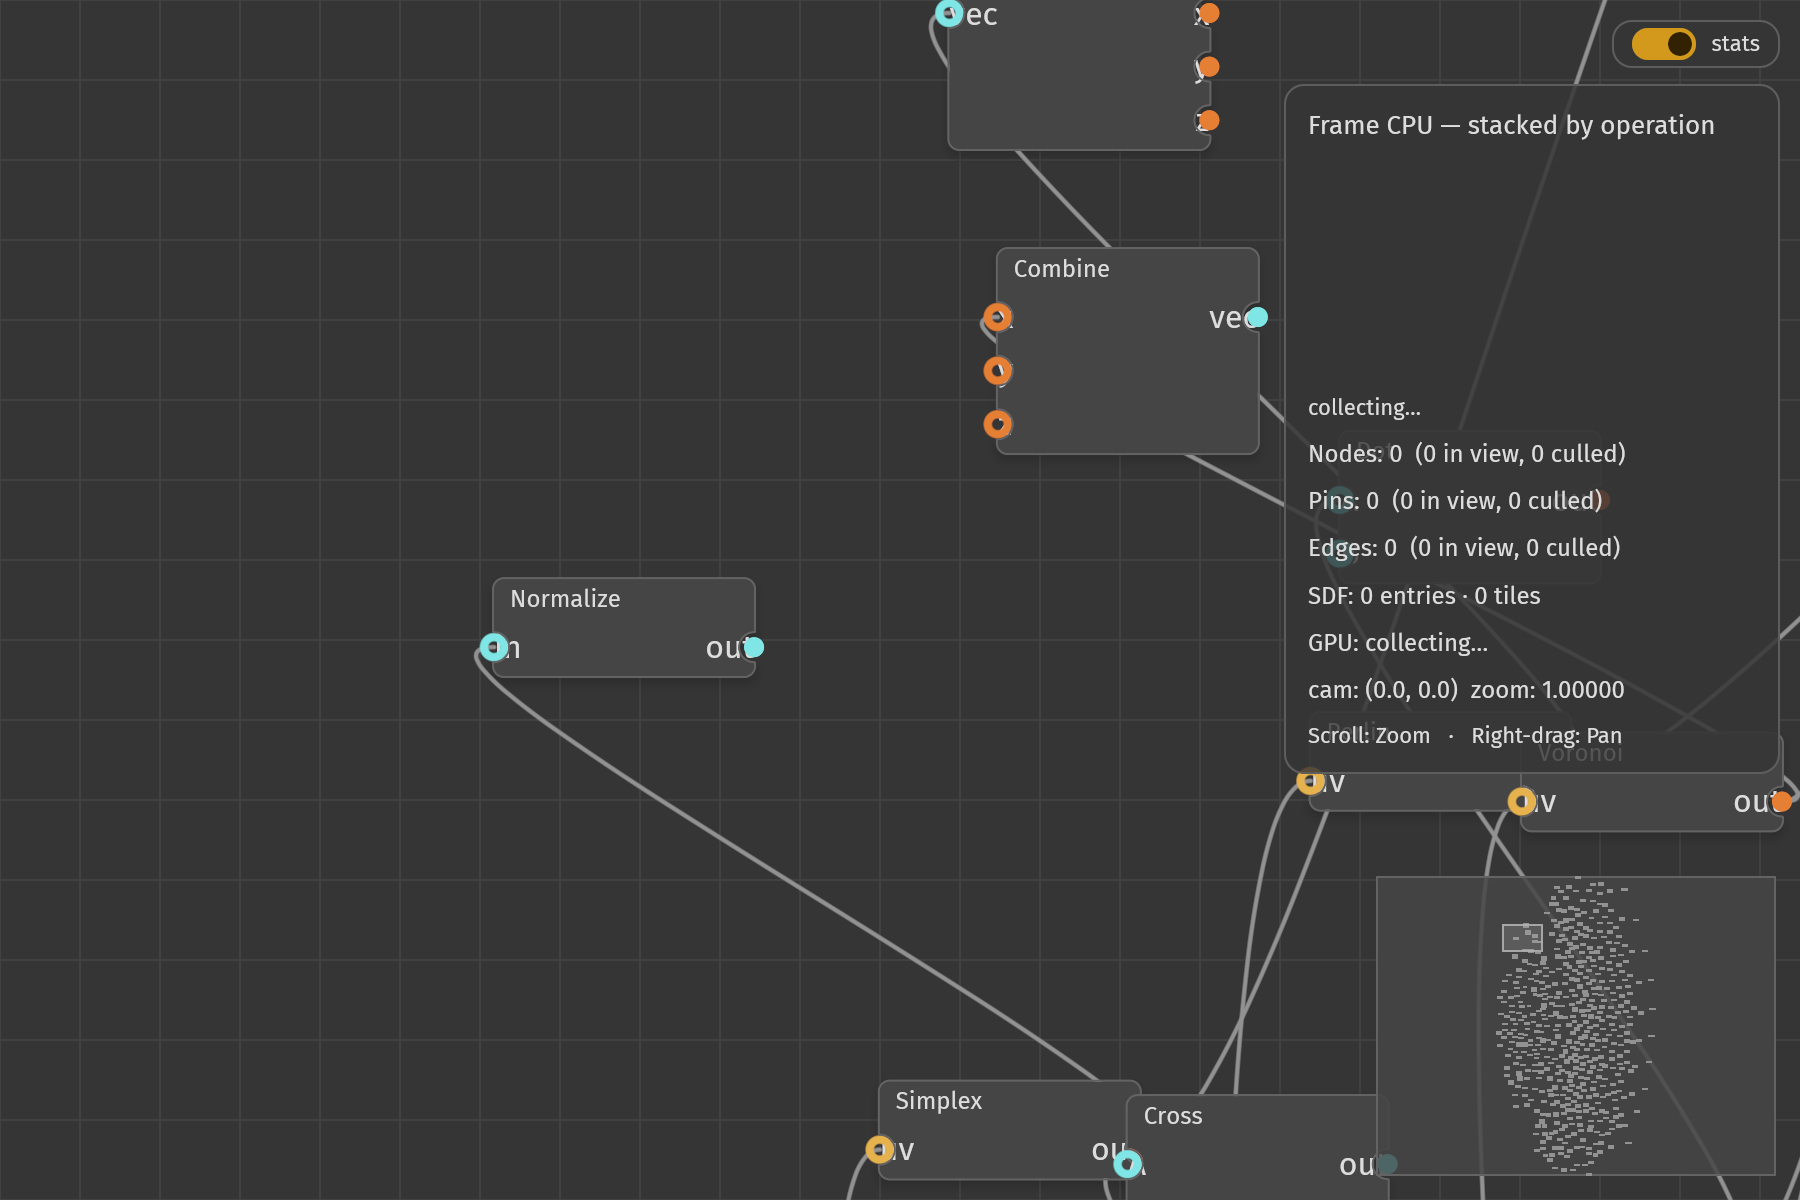
A performance benchmark: a procedurally generated shader/material graph of 500 nodes and 640 edges, with a toggleable stats overlay that reports per-frame operation timings, node/pin/edge counts with cull rates, and the SDF work and memory counters.
§The Graph
The generator builds seven stages, each fed from the one before it: 10 input
sources (UV, Time, Normal, Position), 80 noise generators (Perlin, Voronoi,
Simplex), 100 vector operations (split, combine, normalize, dot, cross), 150
math operations (add, multiply, divide, subtract, power), 100 texture
operations (Sampler2D, ColorMix, Gradient), 50 blend nodes taking two texture
inputs each, and 10 material outputs (BaseColor, Roughness, Metallic, Emission,
Normal). A force-directed pass relaxes the column layout before the graph is
handed to the widget. Pins carry a TypeId payload naming their data type, and
the demo’s pin_style colors them by it.
Selection and group move are supported: the host keeps the selected indices and applies the reported move delta to every selected node.
§Controls
- Scroll - Zoom in/out (zoom out to see all 500 nodes)
- Right-drag - Pan the canvas
- Drag nodes - Move individual nodes or the whole selection
- Stats toggle (top right) - show/hide the live timing panel; while hidden the demo renders no frames between interactions
- Minimap (bottom right) - click or drag it to move the camera; the map shows every node and the rectangle the viewport covers
The root README has the full default control table.
§Running
cargo run --release -p demo_500_nodes--release matters here: the numbers in the stats panel are frame costs.
§Diagnosing GPU Cost
The demo doubles as a GPU-cost reporter. NG_REPORT=1 prints hardware
independent work and memory counters every 60 frames, and NG_SCALE,
NG_NODES, NG_NO_EDGES and NG_NO_GRID each vary one axis of the cost. The
knob table, the sweep to run and how to read the report are in
demos/README.md.